Briefing note
Between sampling rounds, see which ponds have turned.
A monthly satellite screen for the ochre and turquoise signatures of acid mine drainage, across the watershed you regulate or report on.
Key
- Screened this month
- Flagged plume
How the watershed is watched today
Your monitoring programme is a list of sampling points and a rota. A field team drives out, takes the sample or the field reading, bottles go to the lab, and the results come back when the lab has them. It works for the points on the list. The trouble is everything that is not on it, and everything that changes between visits.
Legacy workings are the worst of it. Old adits, spoil heaps and tailings ponds that no operator looks after sit all over the catchment, some of them up tracks nobody wants to drive. A pond can turn orange in spring and stay that way until its slot on the rota comes round. A new seep can stain a reach and nobody sees it between visits. Often the first you hear of it is a call from someone downstream.
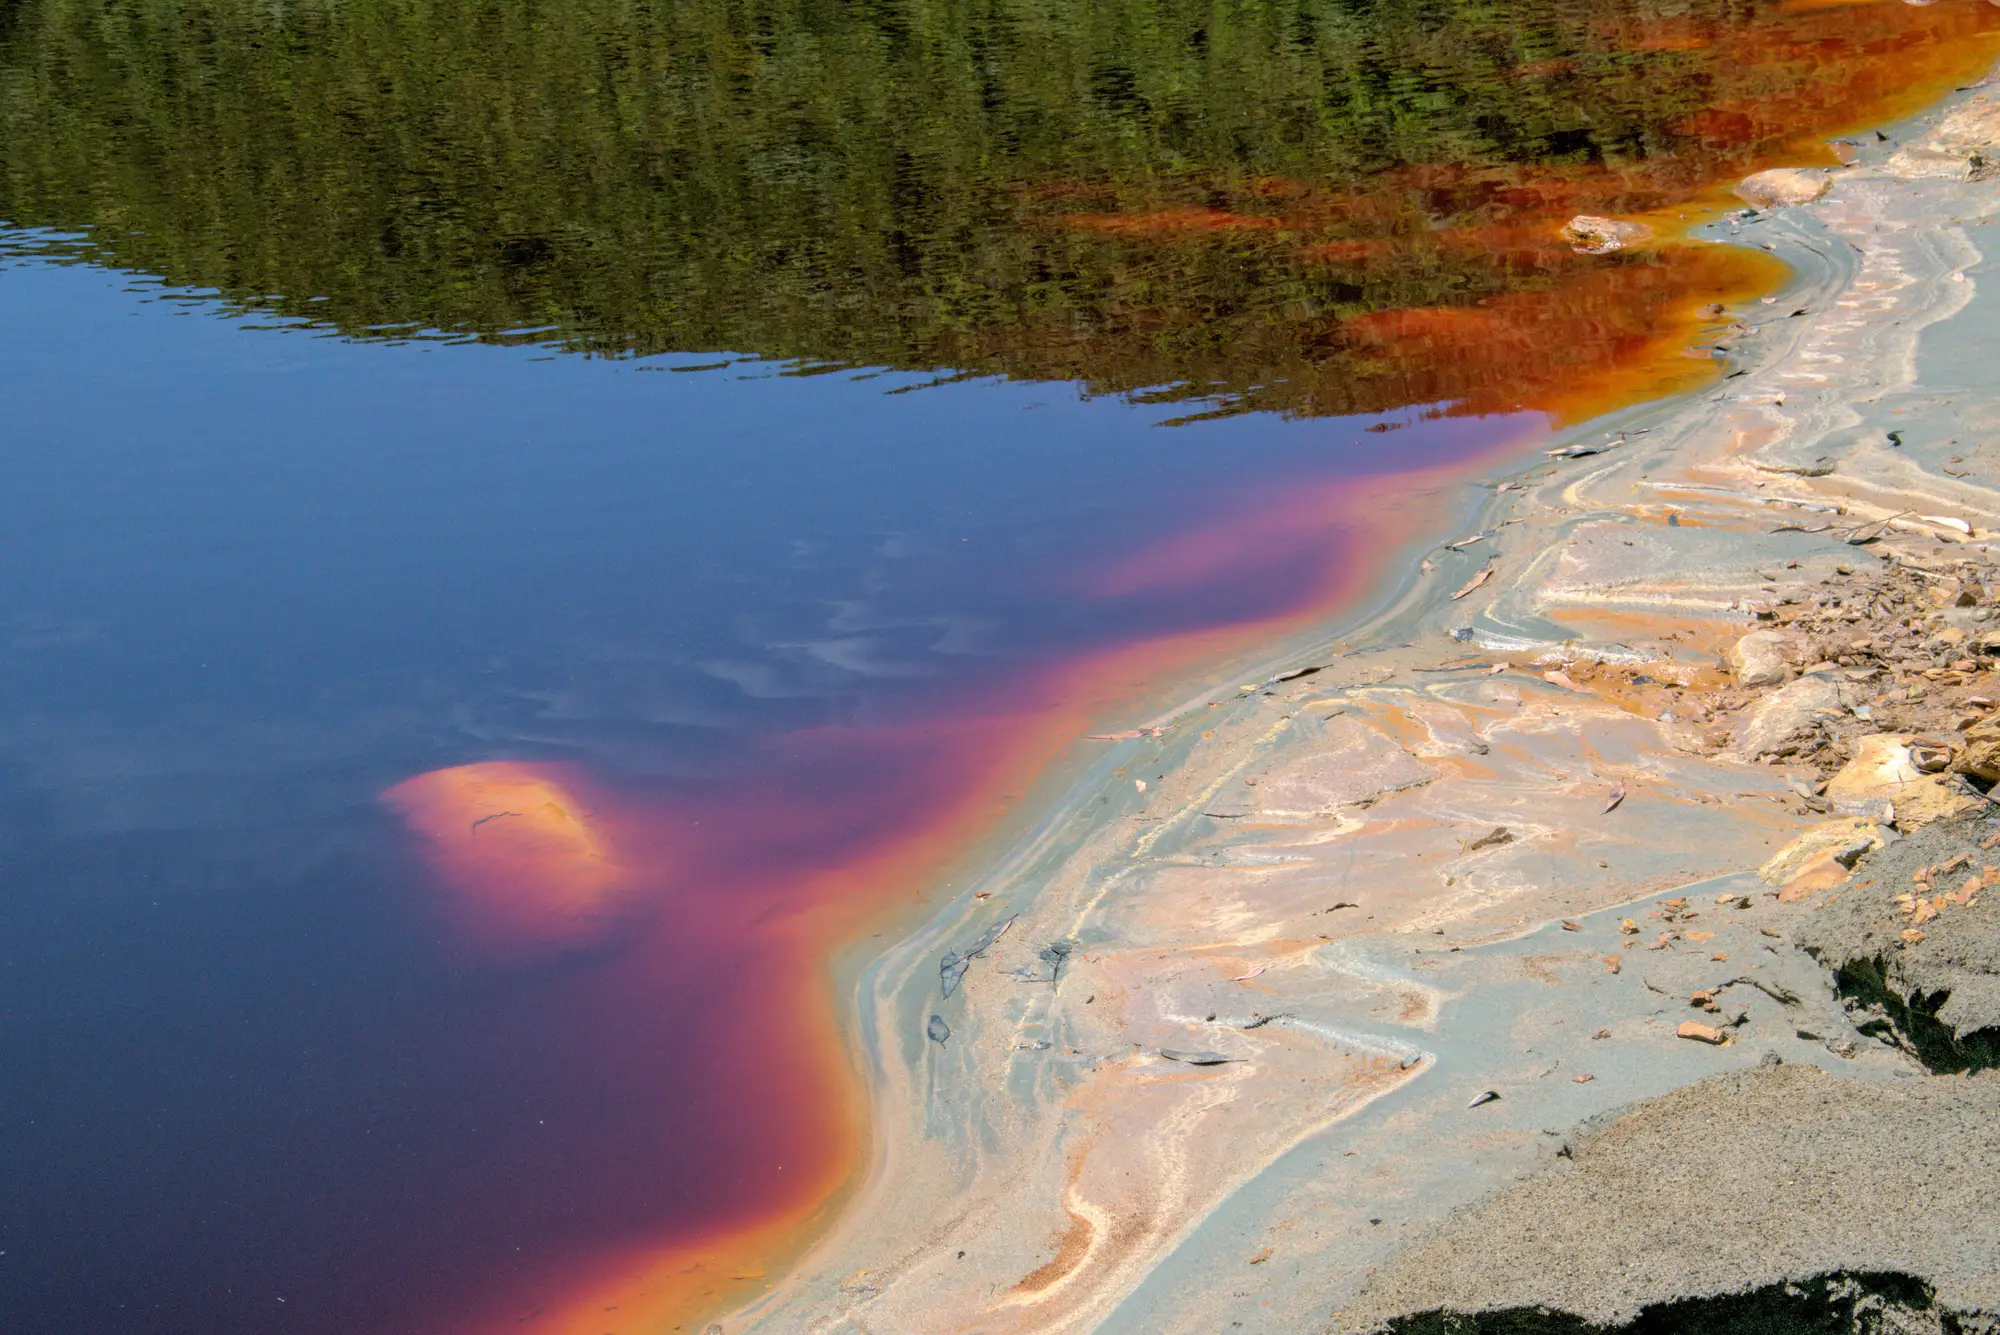
Ochre at the edge of a pond. A photograph from the ground, for illustration.
Sending a team to every pond is not going to happen, and nobody is asking for it. What you need is a way to know which few sites deserve the next visit, so the rota follows the water instead of the calendar.
This is that: a monthly look at the whole watershed from orbit, flagging the ponds and reaches that show the colours of acid drainage. A flag does not tell you what is in the water. It tells you where to send the bottles first.
What arrives each month
The pilot runs on one defined watershed for an agreed number of months.
Flagged-pond list
CSV or GeoPackage
Each pond or impoundment in the watershed that shows the ochre or turquoise signature in that month's pass, with its position and the date of the scene. Ponds that showed nothing are not listed, and ponds too small to resolve are named as a limit, not guessed at.
Downstream plume extent
GeoPackage or shapefile
Where a flagged source is upstream of a stained reach, the reach that shows the signature is traced as a line or polygon layer, so you can see how far the colour runs. It is an extent of colour in the image, not a concentration.
Watershed screening map
Layer for QGIS or ArcGIS
One layer for the whole watershed, combining the flags and plumes for the month over your own boundary. It opens in the GIS you already run, next to your sampling points.
Monthly summary
PDF
A short write-up for the file: what was flagged, what changed since last month, which months had no usable scene, and a plain statement that every flag needs ground sampling to confirm. Written to drop into an annual monitoring report or an ESG screening file.
How it works
Define the watershed
You send the boundary as a shapefile or GeoPackage, plus your list of known sampling points and known legacy workings if you have them. We agree the pilot length.
Monthly pass
Each month we pick the clearest wide-swath multispectral scene over the watershed. A cloudy month may have none, and the summary says so.
Screen the signatures
The scene is screened for the ochre and turquoise colours of contaminated ponds and downstream plumes. A project team reviews the flags before delivery.
Delivery
The flag list, plume layer, watershed map and summary arrive together, in formats that open in your GIS.
Check on the ground
You choose which flags to visit. Your own sampling results are the confirmation. If you send them back, they can be set beside the flags in the next summary.
Limits
These are the ways a spectral screen can mislead you. Each one is stated in the monthly summary too.
A flag is not a result
The screen reads colour. Orange and blue-green water can be harmless, and contaminated water can look clear. Only ground sampling and the lab tell you the chemistry.
10–30 m is the floor
Wide-swath imagery puts one pixel at 10 to 30 m across. A small pond may cover a pixel or less and will not show as a distinct signature. Narrow seeps and streams can go the same way.
Cloud and daylight
The screen needs a clear, sunlit scene. A cloudy month, or a winter month at high latitude, can leave a gap, and gaps stay in the record.
Monthly is a target
One pass a month is what we aim for. It is not a guaranteed revisit and it is not a continuous watch. A discharge that starts and stops between passes will not be seen.
It sees surface colour
Water under a cover, in a flooded shaft or underground is invisible to it. So is a discharge into a stream that carries too little colour to show at this pixel size.
Who it's for
Who it's for
- Regulators and inspectors who run a water-quality monitoring programme across a catchment with legacy or active workings.
- ESG analysts who screen a watershed around a holding or a borrower and need a documented remote look.
- Teams that want to rank ponds and reaches for the next sampling round.
Who it's not for
- Teams that need a confirmed contamination result or a concentration figure. That takes a sample and a lab.
- Compliance sign-off. This is a screen to prioritise visits, not a substitute for regulatory testing.
- Real-time discharge alarms. A monthly pass is far too slow for that.
- Single-site, metre-scale inspection of one pond. A drone flight or a site visit does that job better.
Questions from regulators and analysts
Does a flag mean the water is contaminated?
No. A flag means the pond or reach shows the ochre or turquoise colour that acid drainage often produces. Ground sampling is what confirms it.
Does this replace our sampling programme?
No. It ranks where to sample next. Your rota, your field team and your lab results stay exactly as they are.
Can it see small ponds?
Not reliably. At 10–30 m GSD a small pond may fall inside one pixel and not stand out. The limit is stated in every monthly summary.
What does cloud do to the monthly screen?
A month without a clear scene leaves a gap, and the summary says so. The next usable pass picks the record up again.
How do we check the flags against our own data?
Every flag carries the scene date, so you can set it against your sampling results from the same month. Send your results back when you have them and they can be shown beside the flags in the next summary.
Will it work with our GIS and site register?
The layers are delivered as GeoPackage or shapefile and open in QGIS or ArcGIS. Your list of known workings can be carried over so the flags line up with the sites you already track.
Who owns the layers you deliver?
Use and ownership terms for the delivered layers are written into the contract before the pilot starts. The public satellite archives the imagery comes from keep their own licences.
How is the pilot priced and bought?
Each pilot is scoped and quoted on its own: watershed size, number of months and what you want delivered. You get a written scope you can take through your procurement.